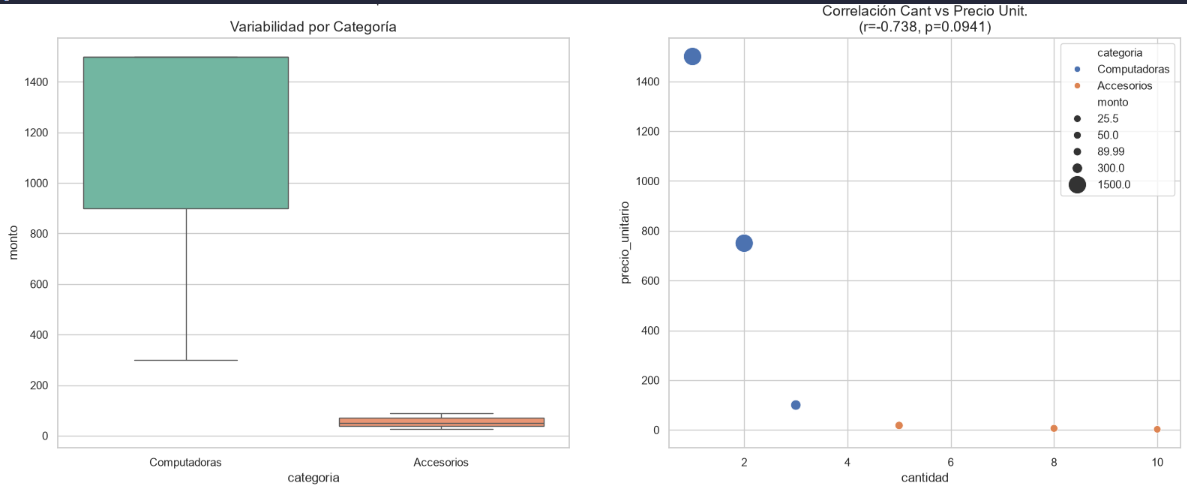
Exploratory Data Analysis
Full EDA pipeline connecting to a serverless PostgreSQL database (Neon). Includes Pearson correlation, Gaussian KDE, coefficient of variation, and publication-ready charts with matplotlib and seaborn.
01 / ABOUT
Industrial engineer turned data. I learn by building real projects and reading official documentation — no bootcamps, no shortcuts.
Junior — actively learning
$ python -c "import mauro"
>>> mauro.role
'Data Analyst · Industrial Engineer'
>>> mauro.stack
['Python', 'SQL', 'Pandas', 'Streamlit', 'Plotly']
>>> mauro.level
'junior — learning by building ✓'
>>> ▌02 / SKILLS
Every tool learned by building
real projects and reading official documentation.
03 / WORK
Full EDA pipeline connecting to a serverless PostgreSQL database (Neon). Includes Pearson correlation, Gaussian KDE, coefficient of variation, and publication-ready charts with matplotlib and seaborn.
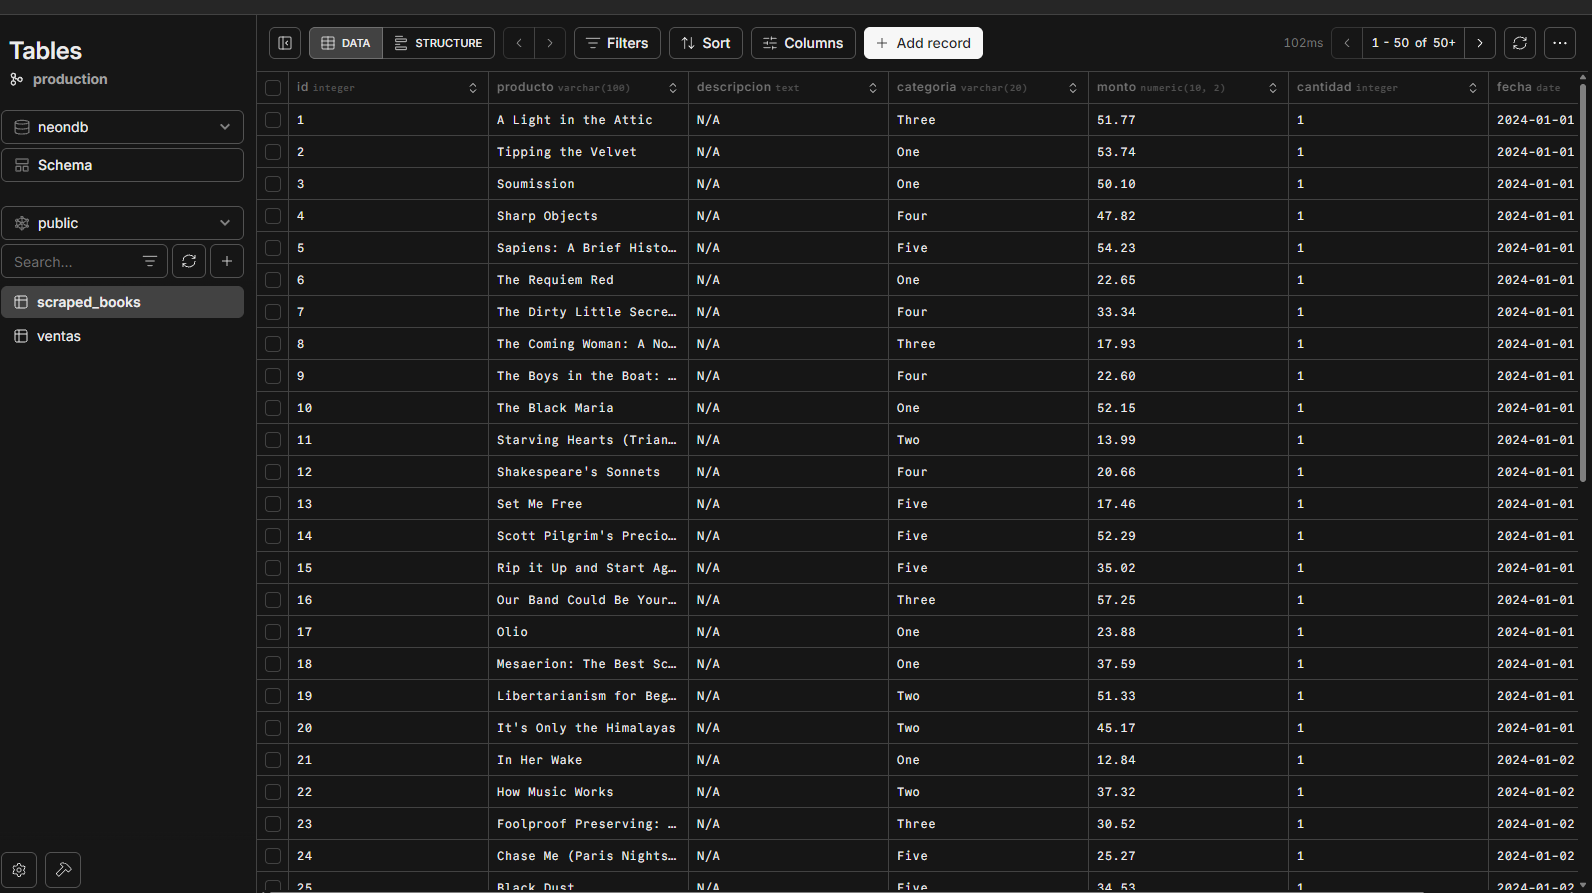
Headless browser scraping with Playwright (Chromium) and regex cleaning. Appends structured data to PostgreSQL via pandas.to_sql with ethical rate-limiting. Secrets managed with python-dotenv.
Streamlit app with dynamic filters and 300s cache. Visualizes datasets with Plotly Express (bar, histogram, box plots). Deployed on Streamlit Cloud — no server setup needed.
All code is public — built from scratch, no templates.
04 / CONTACT
Available for freelance data analysis, dataset cleaning, interactive dashboards and scraping. If you have raw data, I can help.